Wednesday, July 22, 2026Vol. III · No. 203Subscribe
The Mining, Energy & Technology Wire
Renewables · Analysis

Solar and Storage Hit 91% of New US Grid

Solar and battery storage captured 91% of new US grid capacity in Q1 2026, even as China's installations plunged 66% and wind developers face a permitting crisis that has sent PPA prices soaring.

Solar and Storage Hit 91% of New US Grid
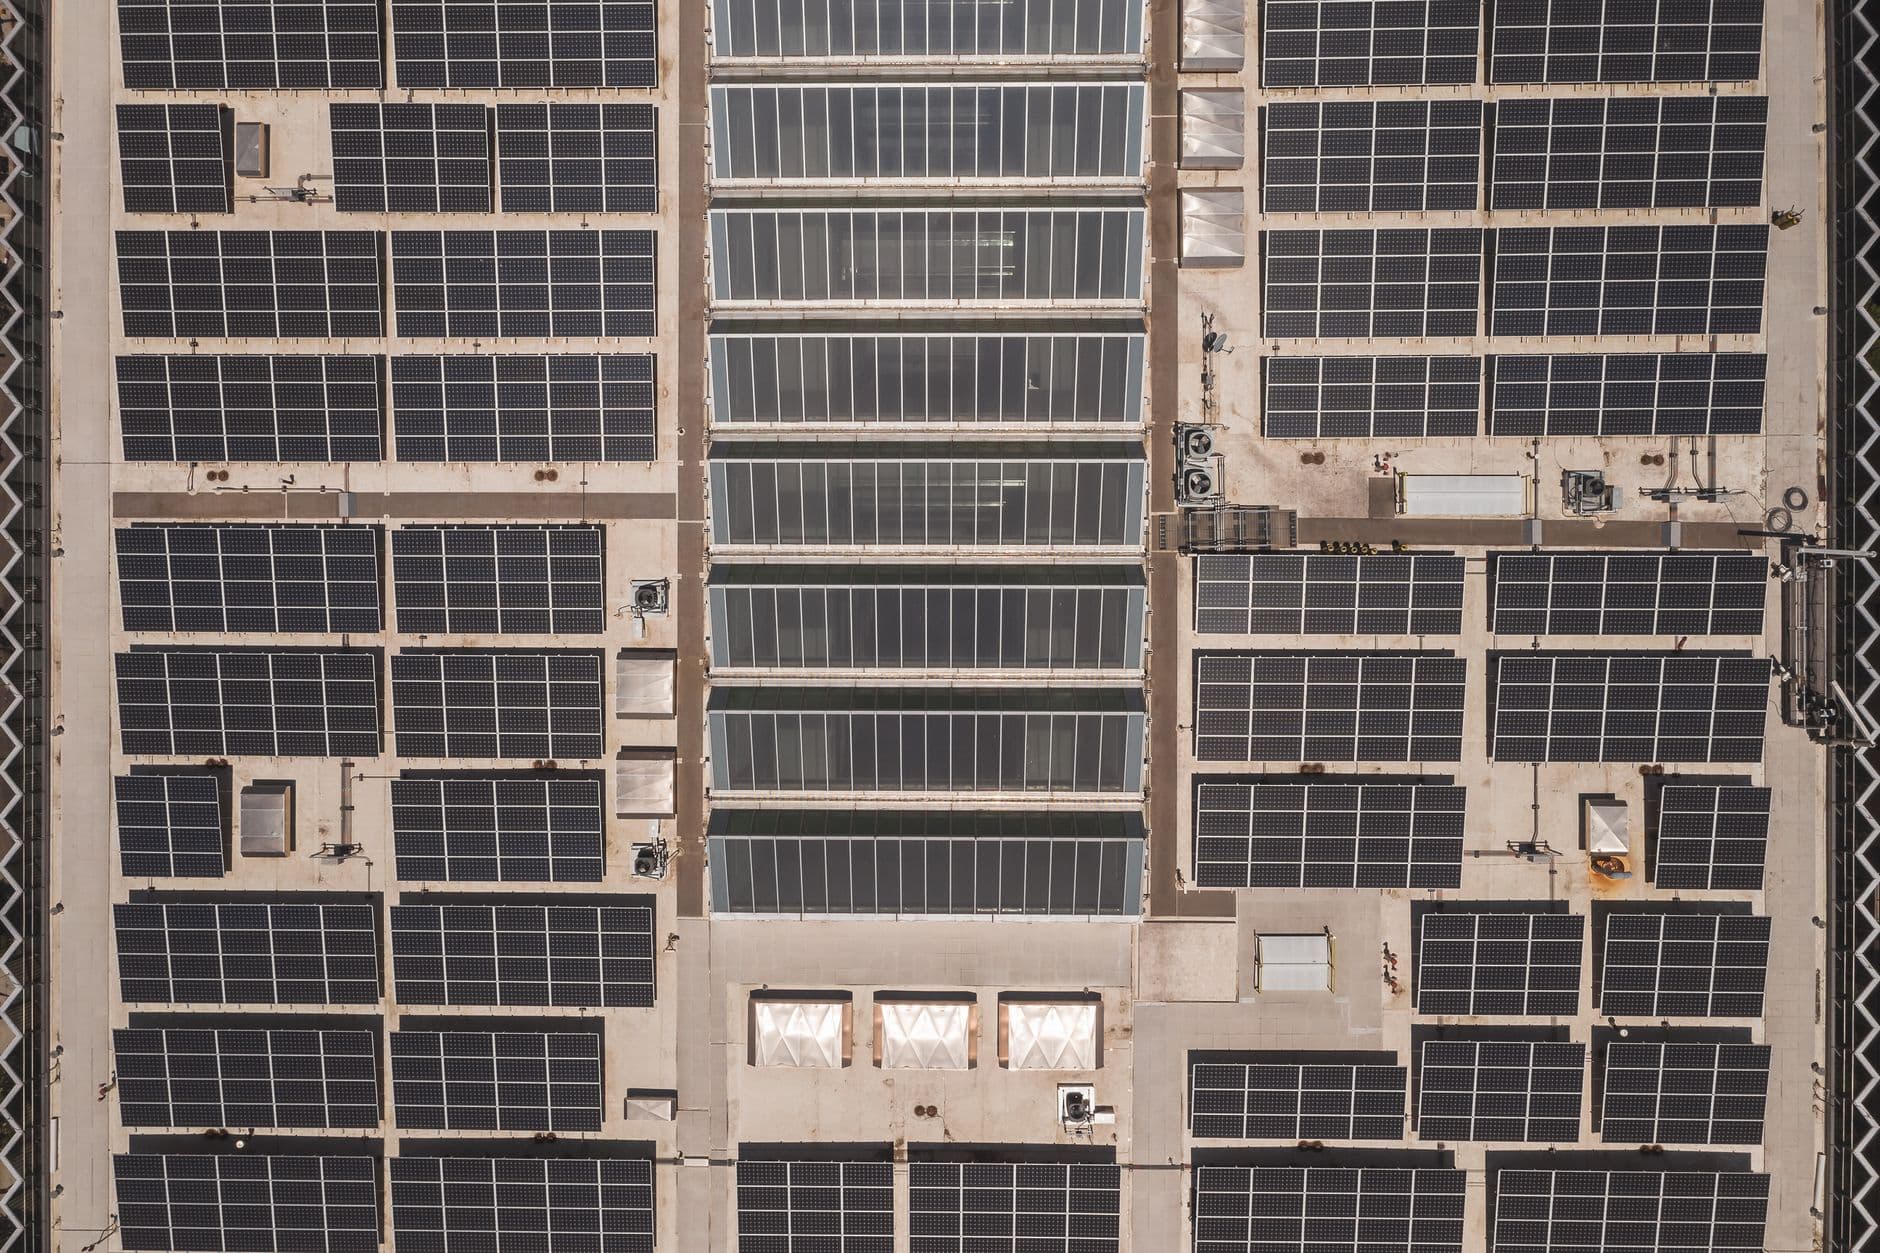
PhotographSolar and battery storage captured 91% of new US grid capacity in Q1 2026, even as China's installations plunged 66% and wind developers face a permitting crisis that has sent PPA prices soaring.

Solar and battery storage claimed 91% of all new electricity capacity added to the US grid in the first quarter of 2026. That's not a typo. Wind, natural gas, coal, and nuclear combined for the remaining 9%, according to data from the Solar Energy Industries Association and Wood Mackenzie.

Energy storage hit a record 9.7 gigawatt-hours in Q1 2026 , while renewables accounted for 30.0% of total US electrical generation during the first third of 2026 – up from 27.8% a year earlier , the Energy Information Administration reported. The surge comes as the US prepares to add 86 GW of new utility-scale generating capacity in 2026, nearly doubling the 53 GW installed in 2025 . Yet this buildout is unfolding against a backdrop of collapsing installations in China, permitting bottlenecks that have paralyzed US wind development, and power purchase agreement prices climbing to record highs.

Can the US Sustain This Pace?

Not if permitting delays continue. The SEIA report noted that 457 solar and storage projects totaling 100 gigawatts have permits pending and are vulnerable to politically motivated delays or cancellations . Michelle Davis, head of solar at Wood Mackenzie, warned that "We are forecasting that US solar additions will be flat over the next five years despite the need for more power supply in the US" .

Wind faces even steeper headwinds. Lengthy bottlenecks, especially regarding Federal Aviation Administration (FAA) approvals for turbine height and location, have stalled significant amounts of wind development across the United States , according to PV Magazine. The result: The average North American solar power purchase agreement price rose 4.7% during the first quarter of 2026, while wind prices rose nearly 8%. Solar and wind PPA costs have increased 13% and 24%, respectively, since this time last year , LevelTen Energy data shows.

Wind energy enjoys particularly strong demand, but remains in scarce supply; growing scrutiny of wind permits at the federal level means new-build wind projects have "completely fallen off the map" in regions such as PJM , Rob Collier, vice president of the LevelTen Energy marketplace, told Utility Dive. The Trump administration's permitting freeze and Department of Defense objections on national security grounds have created what one analyst called the hardest environment for project development "it's ever been."

What Happened to China's Solar Boom?

It hit a wall. New solar PV installations in China reached 50.9GW between January and April 2026. Installation figures for the first four months of 2026 represent a 51% drop compared to the 104.93GW registered in the same period of 2025 , according to data from China's National Energy Administration cited by PV Tech. Reuters reported that developers added just 9.52 gigawatts of new capacity in April, a sharp drop from the 45 GW installed in April 2025, when companies rushed to complete projects before a major policy change in the pricing mechanism for solar power output .

The collapse was predictable. Much of that growth was driven by developers rushing to complete projects ahead of a June 1, 2025, deadline, which marked the shift from fixed pricing mechanisms to a more market-driven system . The China Photovoltaic Industry Association estimates installations at 180 GW to 240 GW AC in 2026, which will be 24% to 43% lower than the 315 GW AC installed in 2025 .

Yet China's renewable ambitions remain intact. By the end of March 2026, the country's total power generation capacity reached 3.96 terawatts, representing a year-on-year increase of 15.5%. Solar energy accounts for 1.24 TW of this total, while wind power contributes 660 GW .


Why Is the UK Doubling Down on Wind?

Because existing assets still work—and can be made to work better. ScottishPower announced plans this week to invest £1.5bn in a project to double the capacity of Whitelee Wind Farm, the UK's largest onshore wind farm, which could generate enough energy to power the equivalent of 650,000 homes – more than double its current capabilities , STV News reported. Under the new plans, the number of turbines will be reduced to 124 larger structures around 250m in height, taking capacity from 539 megawatts to 1 gigawatt .

The move reflects a broader European strategy: upgrade what you have rather than fight for new permits. As well as the £1.5 billion investment to expand and repower the windfarm, there will also be continued investment over 40 years for the operation and maintenance of the site , Renewable Energy Magazine noted. The project is expected to be operational by 2035.

Meanwhile, fossil fuel generators are enjoying a windfall. Equinor reported that it saw a 93% jump in its second-quarter profit from a year earlier as oil and gas prices soared during the Middle East crisis , OilPrice.com reported. The Norwegian major posted adjusted operating income after tax of $3.225 billion for the second quarter, up by 93% from the $1.670 billion for the same period last year . The contrast is stark: oil and gas majors print record earnings while clean energy developers struggle to finance projects at PPA prices that have climbed 13% year-over-year.

What Changed This Week

The US clean energy buildout hit a new milestone—91% of Q1 capacity additions—but the path forward narrowed considerably. Permitting bottlenecks that were theoretical concerns six months ago are now quantified: 100 GW of solar and storage projects sit in regulatory limbo. Wind PPA prices jumped 8% in a single quarter as supply evaporated. And China's solar market, which added more capacity than the rest of the world combined in 2025, is now contracting at a pace that will reshape global manufacturing and pricing dynamics through 2027.

What to Watch

The EIA will release its mid-year electricity outlook in early August, which should clarify whether the 86 GW target for 2026 remains achievable given current permitting delays. Watch for Q2 PPA pricing data from LevelTen Energy in late July—if wind prices continue climbing at the Q1 pace, corporate buyers may begin shifting procurement strategies toward solar-plus-storage hybrids. And keep an eye on China's June installation figures, due in late July from the National Energy Administration; if the decline moderates, it could signal the pricing transition has stabilized faster than the industry expected.

Original reporting and analysis by the Stake & Paper editorial team. See linked sources within the article.

Share this story

More from Stake & Paper

Was this article helpful?

ClaimWatch

Mining claims intelligence — from query to report, in minutes.

Every unpatented mining claim across all twelve BLM states. Leadfile audits, due diligence, site selection, regional prospecting, entity investigations, and AOI monitoring — delivered as complete report packages.

4.4M+
Claims Tracked
12
BLM States
7
Report Types
Request a Sample Report
Stake & Paper AM

One morning brief. The whole energy sector.

Original analysis, the day's most important wire stories, and market data — delivered before your first cup of coffee. Free.