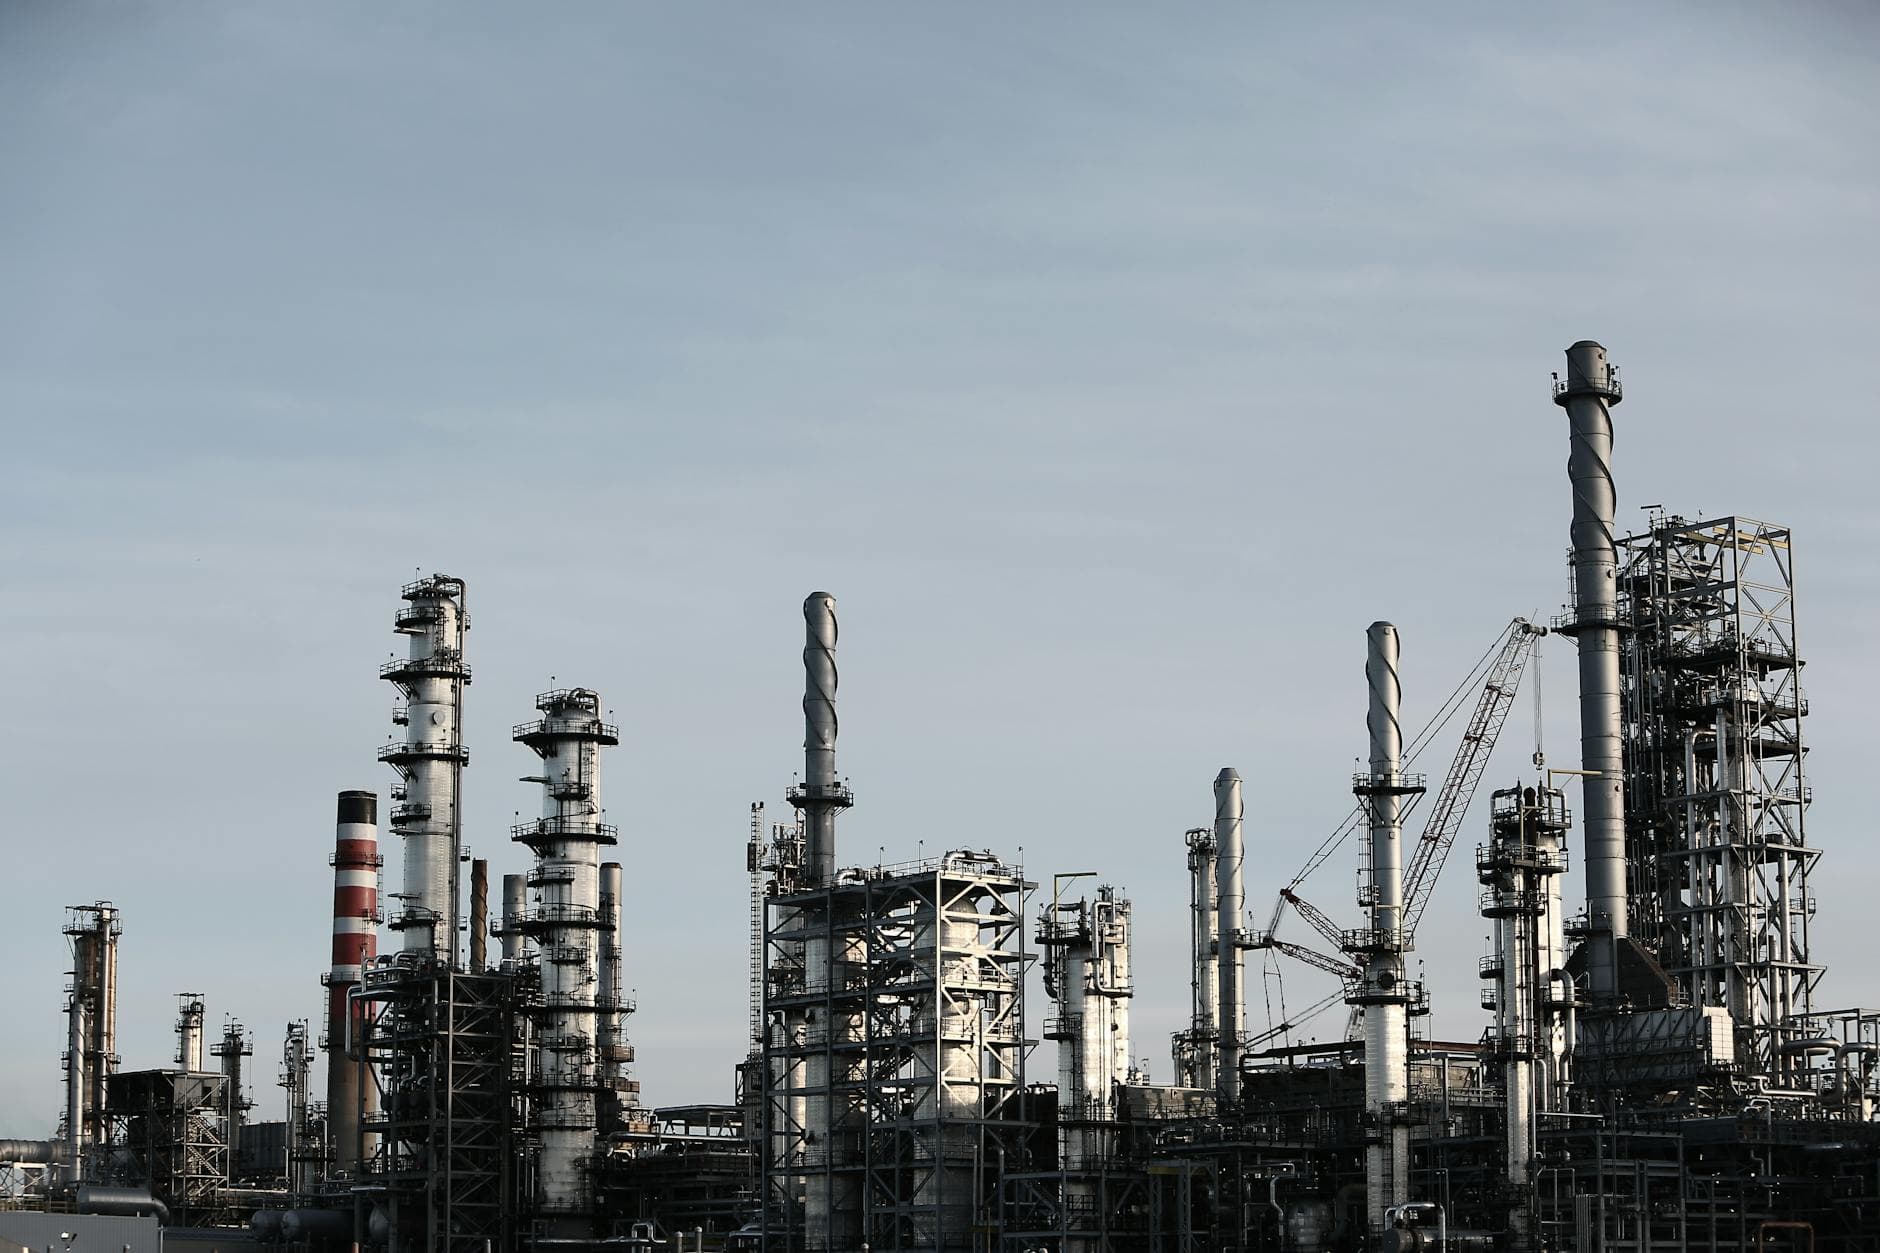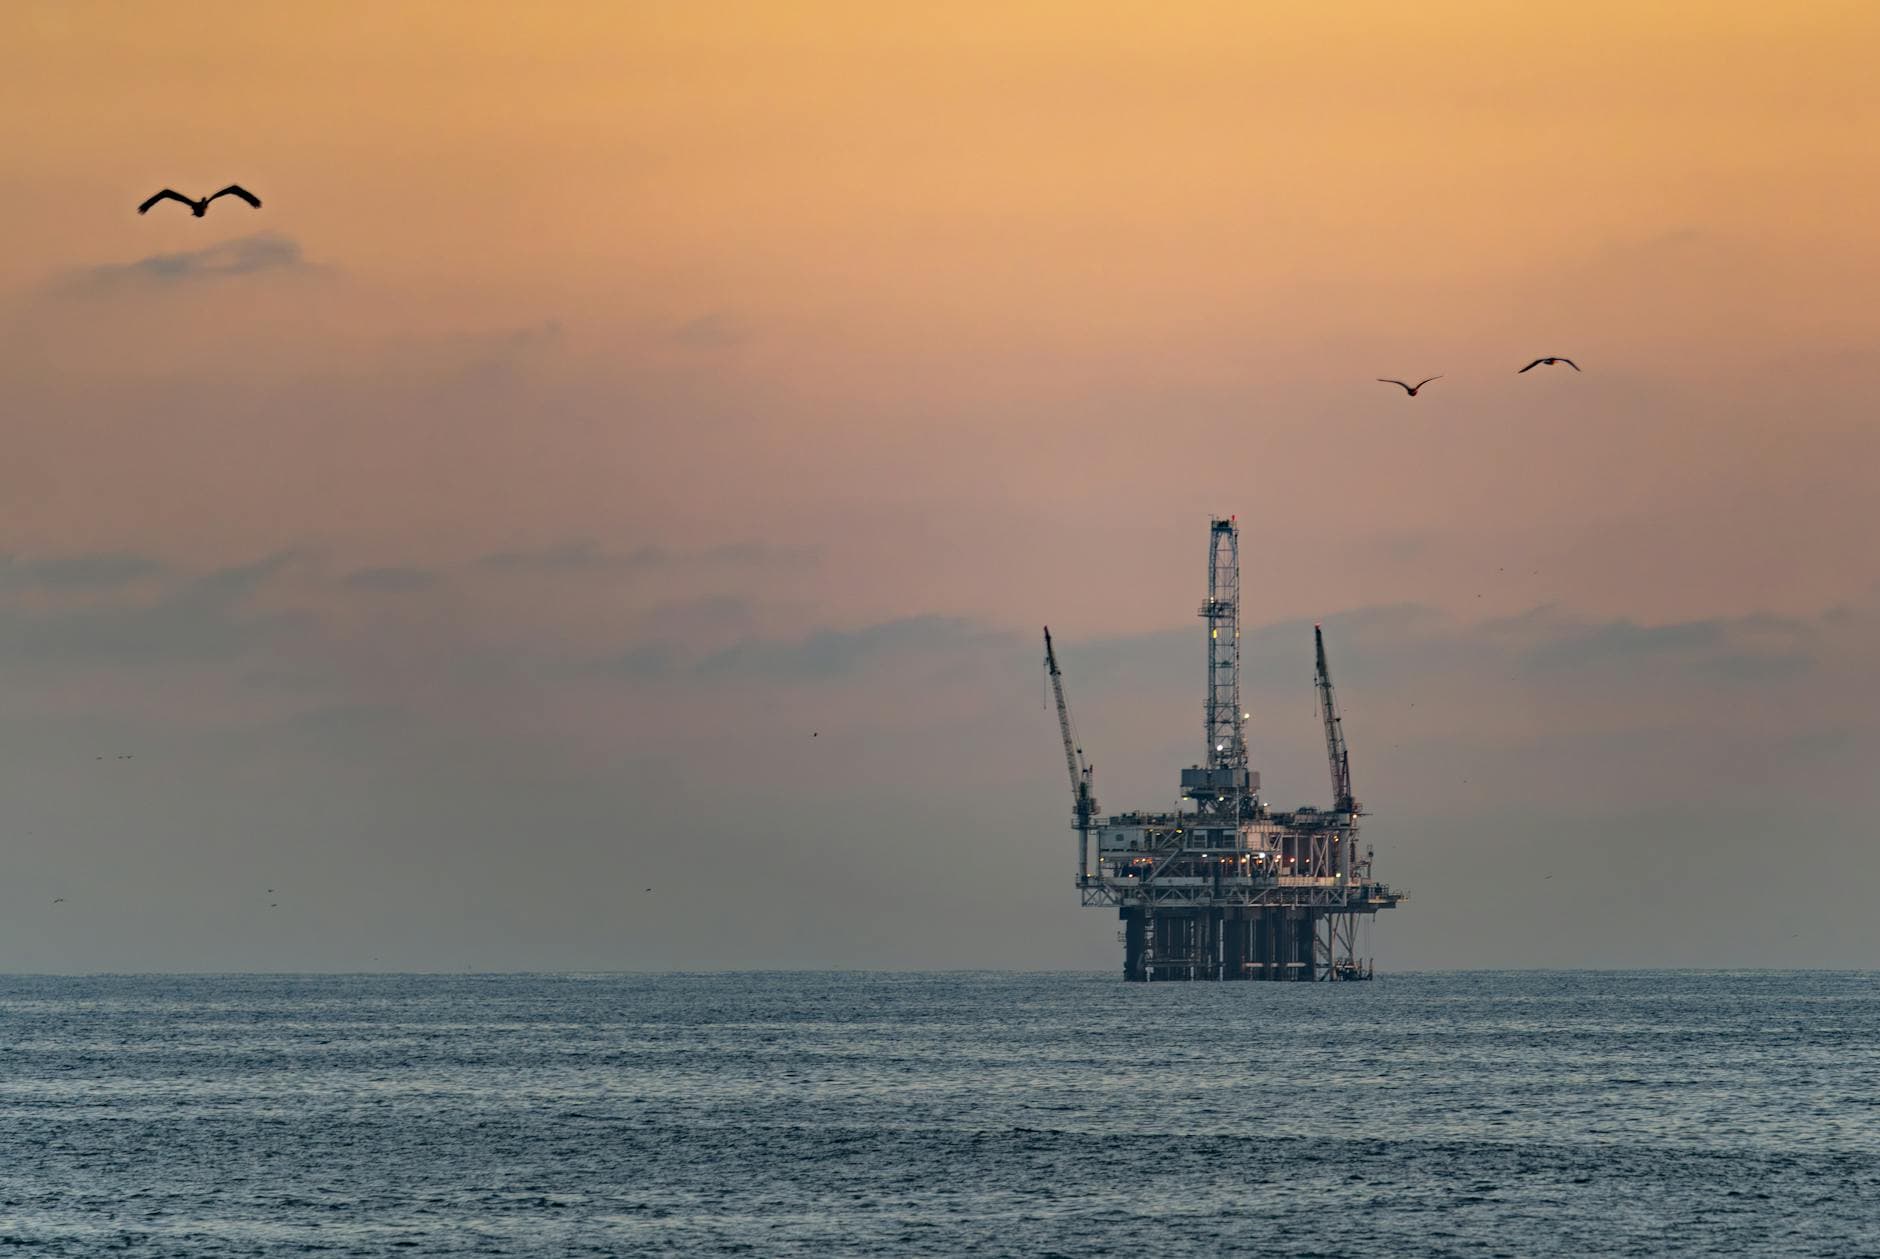
Production as of early May stood at 13.7 million barrels daily. That's up, but not by much. The U.S. benchmark for oil was $105 per barrel on May 4 , yet America's shale patch isn't exactly rushing to drill. The Iran war has handed U.S. producers a gift—prices high enough to justify almost any project—and they're treating it like a trap.
Drilling expansion follows a 40 per cent jump in cost from global supply crunch that has dented president's approval ratings , the Financial Times reported. But the expansion is measured, not manic. Most of the recent production increase is coming from the Permian Basin in Texas, the most productive and cost efficient shale region in the country. Companies including ConocoPhillips, EOG Resources, and Diamondback Energy are increasing drilling and completing previously unused wells to quickly raise output.
Midland, Texas-based Diamondback Energy—the third-largest Permian player after Exxon Mobil and Chevron—said it is adding both fracking (hydraulic fracturing) crews and drilling rigs to West Texas.
Yet the industry's response looks nothing like past booms. Despite strong prices, major energy companies are avoiding aggressive expansion. Producers are focusing on profitability and investor discipline after past periods of overproduction damaged the industry financially.
Can Shale Actually Save the Day?
Maybe not for long. The production boost in response to the war-related crunch now is taking place almost entirely in the Permian—the shale patch's star play, the industry magnet that has seen Big Oil spend tens of billions on acquisitions to get a bigger piece of the top shale pie. But the fast start-fast depletion cycle is as true of the Permian as it is of other shale plays. And this is why the industry is not rushing to add every available rig and complete all uncompleted wells.
The math is brutal. Wells drilled in 2026 may not start to produce until 2036. That kind of long-term investment makes financial sense only if oil prices sustain above $90 a barrel. Nobody believes this war premium lasts a decade. "This is a most likely a transitory event, with the war in Iran, and prices [are] likely to come back down," said Dan Pickering, chief investment officer at Pickering Energy Partners. U.S. producers don't want to spend money to up their oil production based on conflict-dependent prices.
Exports have surged by 60% from February to 6.5 million bpd in April. That's impressive—roughly the entire output of Iraq before the war. But it's coming from existing capacity, not a drilling frenzy. When combined with an even more robust expansion from private operators and the existing growth plans from some oil majors, U.S. shale could add about 815,000 bpd of crude to the global market through 2028 , Citigroup estimated in March. That's helpful. It's not a rescue.
Who's Actually Responding to $4.56 Gas?
Homeowners. As holiday travelers start hitting the road today in record numbers, Memorial Day weekend gas prices are the highest they've been in four years. The national average for a gallon of regular is at $4.56, up 3 cents over last week and $1.38 higher than this time last year , AAA reported Wednesday. The average U.S. gas price on May 12, 2026, was $4.50 per gallon — up 43.6% from $3.14 one year earlier.
The pain is real and immediate. In March, the median lower-income household spent 4.2% of its income on gasoline, up from 3.9% a year earlier and above 2019 levels , according to Bank of America customer data. For a middle-wage earner, an hour of work would pay for about 7 gallons of gas in March, per calculations that economist Jared Bernstein did for Axios. Before the war, you would get 10 gallons for your efforts.
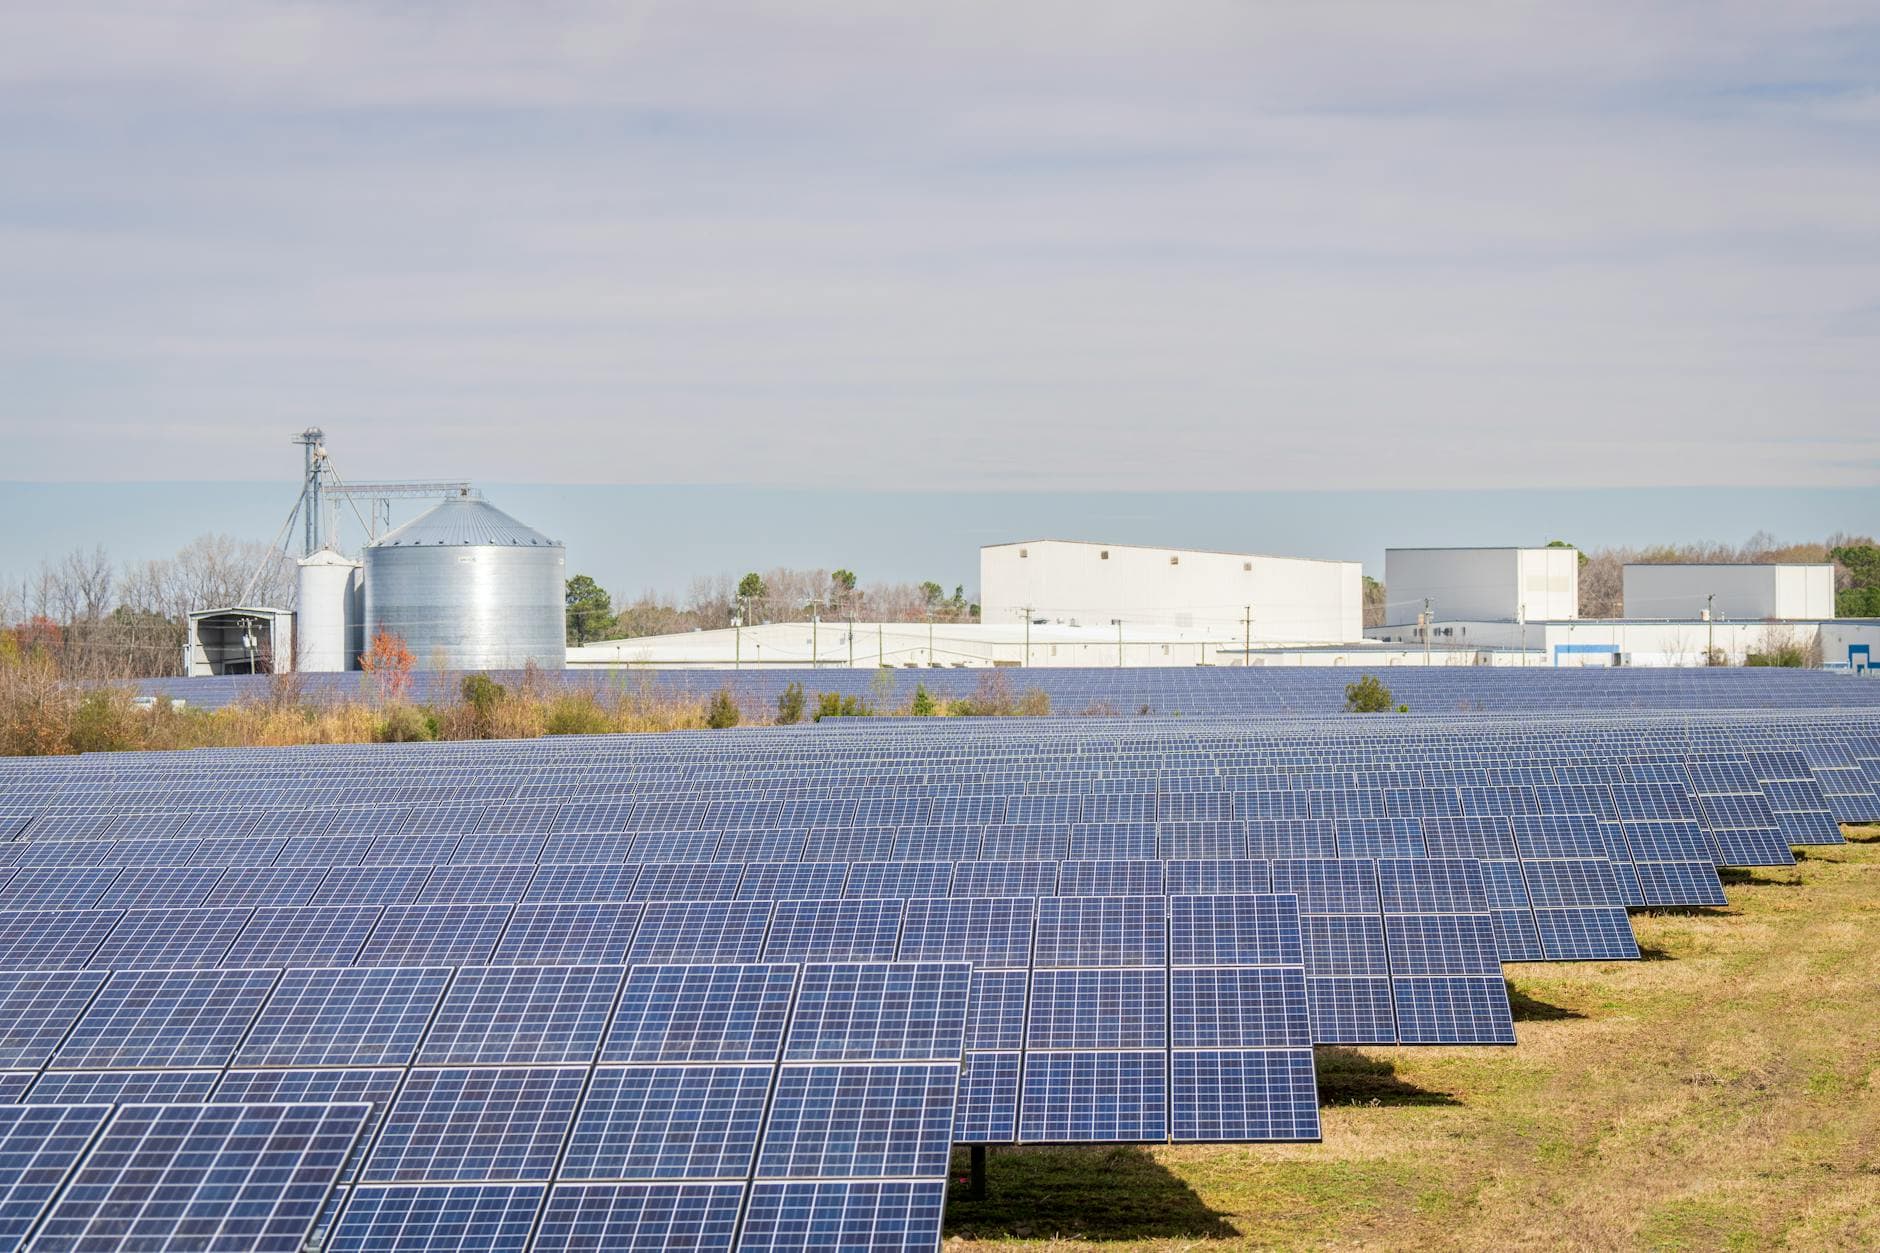
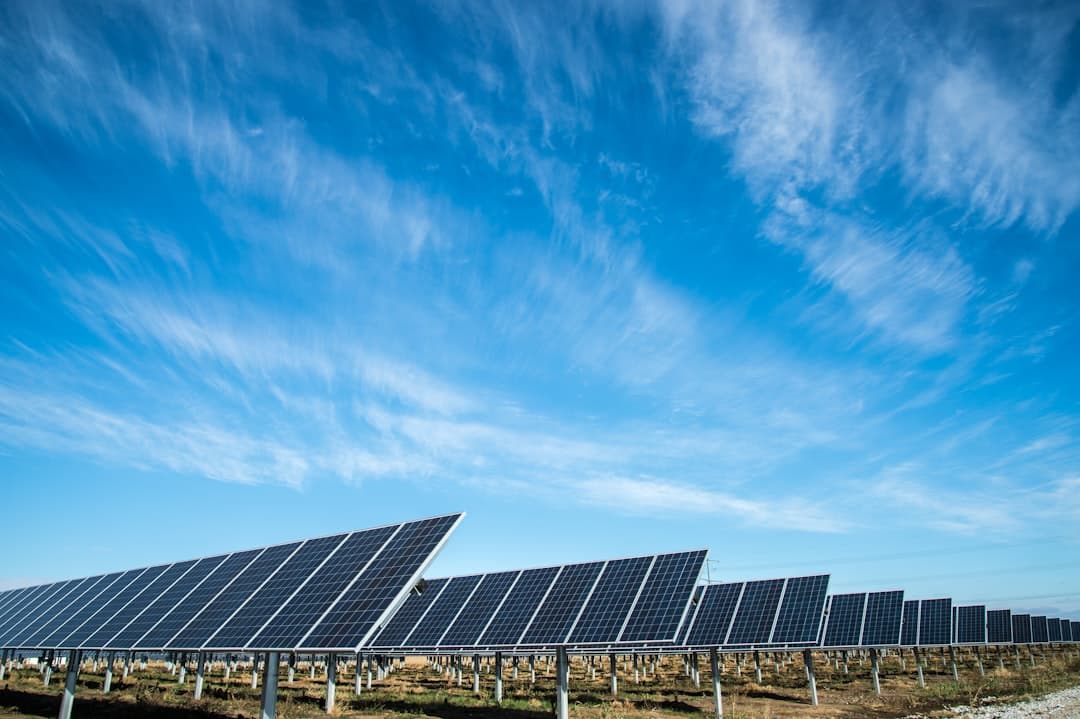
That's driving a residential solar boom that makes shale's response look timid. Households in the U.K. and U.S. are increasingly adopting rooftop solar as oil and gas prices surge following geopolitical disruptions. In Britain, energy providers such as Octopus Energy reported a 54 percent rise in sales between February and March alone, with customers opting for larger solar arrays.
The U.S. market is more complex. The year-end expiration of the Section 25D tax credit for customer-owned solar caused a surge in sales and permitting activity. Ultimately, total installed capacity for 2025 reached 4,647 MWdc, a 2% decrease from 2024. The federal subsidy died December 31. SEIA's Q4 2025 market outlook projects residential installations will contract by around 18% in 2026.
But here's the twist: Falling solar panel and battery costs are making home energy systems more accessible and attractive for consumers seeking long-term savings.
The typical home requires about 12 kilowatts (kW) of solar energy to meet its electricity needs, which costs an average of $30,505 before incentives, according to EnergySage data. Right now, systems average about $2.58 per watt before incentives. That's down from $3.50 per watt just two years ago.