Monday, May 25, 2026Vol. III · No. 145Subscribe
The Mining, Energy & Technology Wire
Renewables · Analysis

Wind and Solar Just Beat Gas Globally

For the first time ever, wind and solar generated more electricity than natural gas worldwide in April—a milestone that arrived during an energy crisis, not because of it.

Wind and Solar Just Beat Gas Globally
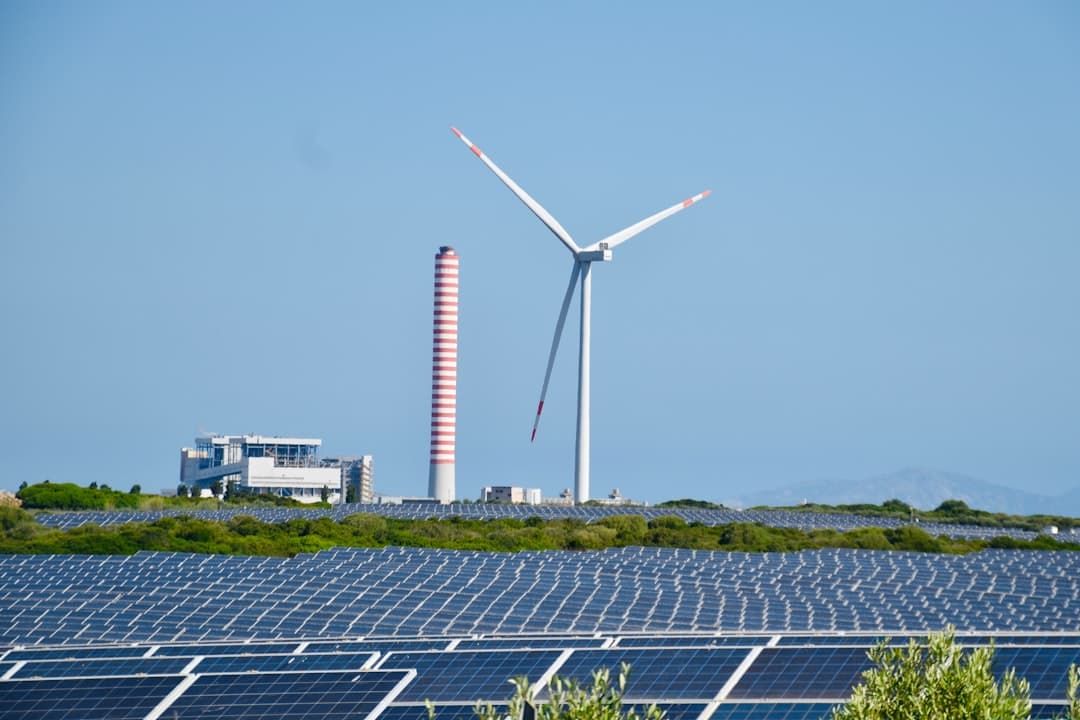
PhotographFor the first time ever, wind and solar generated more electricity than natural gas worldwide in April—a milestone that arrived during an energy crisis, not because of it.

Five hundred thirty-one terawatt-hours. That is how much electricity wind and solar generated globally in April 2026—54 TWh more than gas plants managed, according to analysis from energy think tank Ember. The milestone marks the first time renewables have outpaced gas for a full month, and it happened during the first complete month of the latest Middle East energy crisis, not in spite of it.

Wind and solar produced 22% of the world's electricity in April, compared to 20% from gas, with the two renewable sources generating 531 TWh during the month versus 477 TWh from gas plants , Ember reported. The contrast with five years ago is stark. In April 2021, gas generation stood at nearly identical levels (476 TWh), but wind and solar combined generated just 245 TWh—less than half of this April's output .

Can Grids Handle the Surge?

The speed of the shift is creating new problems. France offers a preview of what happens when solar capacity grows faster than grid flexibility. Solar generation climbed above 20 gigawatts on May 21, and combined with almost 40 gigawatts from France's nuclear fleet, the grid ran a large power surplus with exports to Germany, Italy and the UK reaching over 15 gigawatts , Bloomberg reported.

According to the Storio Energy Price Observatory, 90% of days in April recorded zero or negative prices on the day-ahead market . Prices fell as low as -€479 per megawatt-hour at 2:00 pm on April 26 —approaching the regulatory floor. The culprit? Approximately 6 GW of new solar capacity connected in 2025, much of it operating under feed-in tariff schemes that continue injecting electricity even during negative prices .

Renewable energy curtailed during negative-price periods nearly doubled compared with 2024, reaching almost 3 TWh , according to grid operator RTE. The French government responded in March by approving an agreement establishing a minimum output level for nuclear power to safeguard grid stability , which reduced the system's ability to absorb solar surges.

Where Is the Growth Coming From?

Texas is becoming the laboratory for what a renewable-heavy grid looks like at scale. The EIA forecasts that annual utility-scale solar generation will surpass coal for the first time in 2026 within ERCOT, with solar reaching 78 billion kilowatt-hours compared to 60 BkWh for coal . Solar's share of ERCOT's generation mix has increased from 4% to 12% between 2021 and 2025, while coal's share decreased from 19% to 13% .

The state is expected to account for approximately 40% of all new U.S. solar capacity additions this year . One major project, the Tehuacana Creek 1 Solar and Battery Energy Storage System, is expected to begin operations with an estimated capacity of 837 megawatts .

Globally, the pattern holds. Wind and solar output rose an estimated 13% year over year in April, with strong growth across major markets: China up 14%, the EU up 13%, the UK up 35%, the US up 8%, Australia up 17%, and Chile up 24% , Ember found. The analysis found no evidence of widespread switching from gas back to coal, despite energy security concerns and volatile fuel prices .
What About Storage?

Battery deployment is accelerating to match the renewable buildout. U.S. energy storage developers installed 9.7 gigawatt-hours of new capacity in the first quarter of 2026, marking a record high for the quarter and representing 32% growth from a year ago , according to a report by the Solar Energy Industries Association and Benchmark Mineral Intelligence.

Demand is being driven by data centers, volatile electricity prices and disruptions to global gas supplies, with major technology companies including Google and Meta announcing deals this year to procure tens of thousands of megawatt-hours of storage . Texas, Arizona and California led utility-scale installations in the quarter, with over 70% of utility-scale storage capacity installed in states won by President Trump .

The technology is diversifying beyond lithium-ion. UK-based Invinity Energy Systems was appointed by Switzerland's FlexBase Group to design a vanadium flow battery system of up to 1.5 GWh, potentially expanding to 2.1 GWh, for an AI-focused data center in Laufenburg , the Financial Times reported. FlexBase founder Marcel Aumer said Invinity presented the most compelling overall package with the lowest life-cycle costs, noting the technology's non-flammability, cycle stability and flexibility . If built, it would be the world's largest flow battery project.

What Changed This Week

The April data confirmed what had been building for years: renewables are no longer a marginal source of electricity but a dominant one reshaping global power markets. The milestone arrived not because of crisis-driven fuel switching but because of sustained capacity additions that have doubled wind and solar output in five years while gas generation remained flat. Yet the French experience shows that adding gigawatts of solar without commensurate grid flexibility creates its own problems—negative prices, curtailment, and political pressure to slow deployment.

What to Watch

ERCOT will release its summer demand forecast in early June, which will clarify whether Texas solar can maintain its lead over coal through the peak cooling season. France's energy regulator is expected to publish revised feed-in tariff proposals by mid-June that could tie solar subsidies to storage deployment. The SEIA will release full-year 2026 storage projections in August. And Ember's next monthly electricity data, due in late June, will show whether May sustained the wind and solar lead over gas or whether April was a seasonal anomaly driven by Northern Hemisphere spring conditions.

Coverage aggregated and synthesized from leading energy-sector publications. See linked sources within the article.

Share this story

More from Stake & Paper

Was this article helpful?

ClaimWatch

Mining claims intelligence — from query to report, in minutes.

Every unpatented mining claim across all twelve BLM states. Leadfile audits, due diligence, site selection, regional prospecting, entity investigations, and AOI monitoring — delivered as complete report packages.

4.4M+
Claims Tracked
12
BLM States
7
Report Types
Request a Sample Report
Stake & Paper AM

One morning brief. The whole energy sector.

Original analysis, the day's most important wire stories, and market data — delivered before your first cup of coffee. Free.