Thursday, May 21, 2026Vol. III · No. 141Subscribe
The Mining, Energy & Technology Wire
Oil & Gas · Analysis

Saudi Arabia Burns Oil While Stocks Vanish

The kingdom is importing fuel oil to keep the lights on as natural gas production falls. Meanwhile, global oil inventories are draining at 8.7 million barrels per day—and wind and solar just overtook gas for the first time ever.

Saudi Arabia Burns Oil While Stocks Vanish
PhotographThe kingdom is importing fuel oil to keep the lights on as natural gas production falls. Meanwhile, global oil inventories are draining at 8.7 million barrels per day—and wind and solar just overtook gas for the first time ever.

Saudi Arabia imported 360,000 barrels of fuel oil per day in April—86% more than a year earlier, according to Vortexa data cited by Reuters. The world's largest oil exporter is now buying fuel to burn for electricity because its natural gas production is falling, not rising. The irony would be amusing if the timing weren't so dire.

The kingdom has shut in over 3 million barrels daily of crude production since the Strait of Hormuz closure began, and with it, associated natural gas extraction has dropped , Rystad Energy reported. Summer is peak season for air conditioning in Saudi Arabia, and this year fuel oil and crude consumption for power generation could top 1 million barrels daily —oil that would otherwise flow to export terminals. Every barrel burned at home is a barrel not sold abroad, and at current prices, that's roughly $75 million in foregone revenue each day.

This is happening while global oil stockpiles are being drawn down at a record 8.7 million barrels per day so far in May, nearly double the average pace since the conflict began , Goldman Sachs reported Tuesday. The math is unforgiving. Strategic reserves were built for exactly this scenario, but they cannot be drained indefinitely.

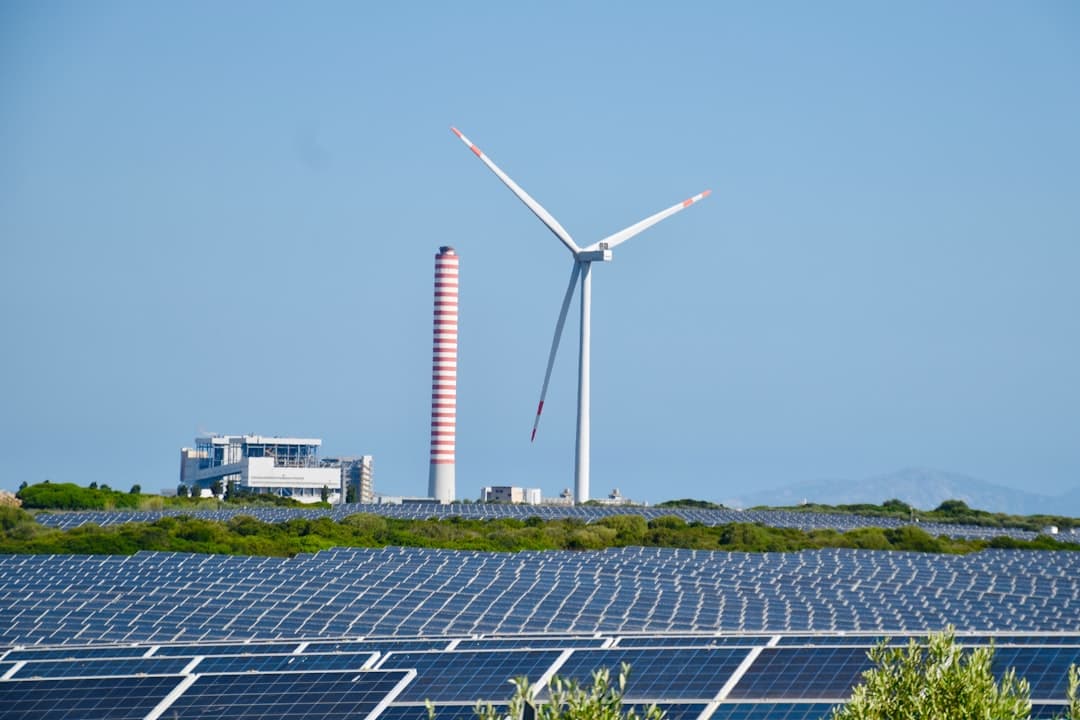
Can Renewables Fill the Gap Fast Enough?

April delivered an unexpected milestone. Wind and solar generated more electricity than gas globally for the first time ever, producing 22% of the world's electricity compared to 20% from gas—531 terawatt-hours versus 477 TWh , according to energy think tank Ember. Five years ago, gas generation stood at nearly the same level. Wind and solar? Less than half of today's output.

The timing is notable—April marked the first full month of the latest global energy crisis , Ember noted. Yet the numbers weren't driven by the crisis itself but by years of rapid renewable growth that met most of the increase in global electricity demand, helping limit growth in gas generation . The current energy shock didn't create this shift. It merely revealed it.

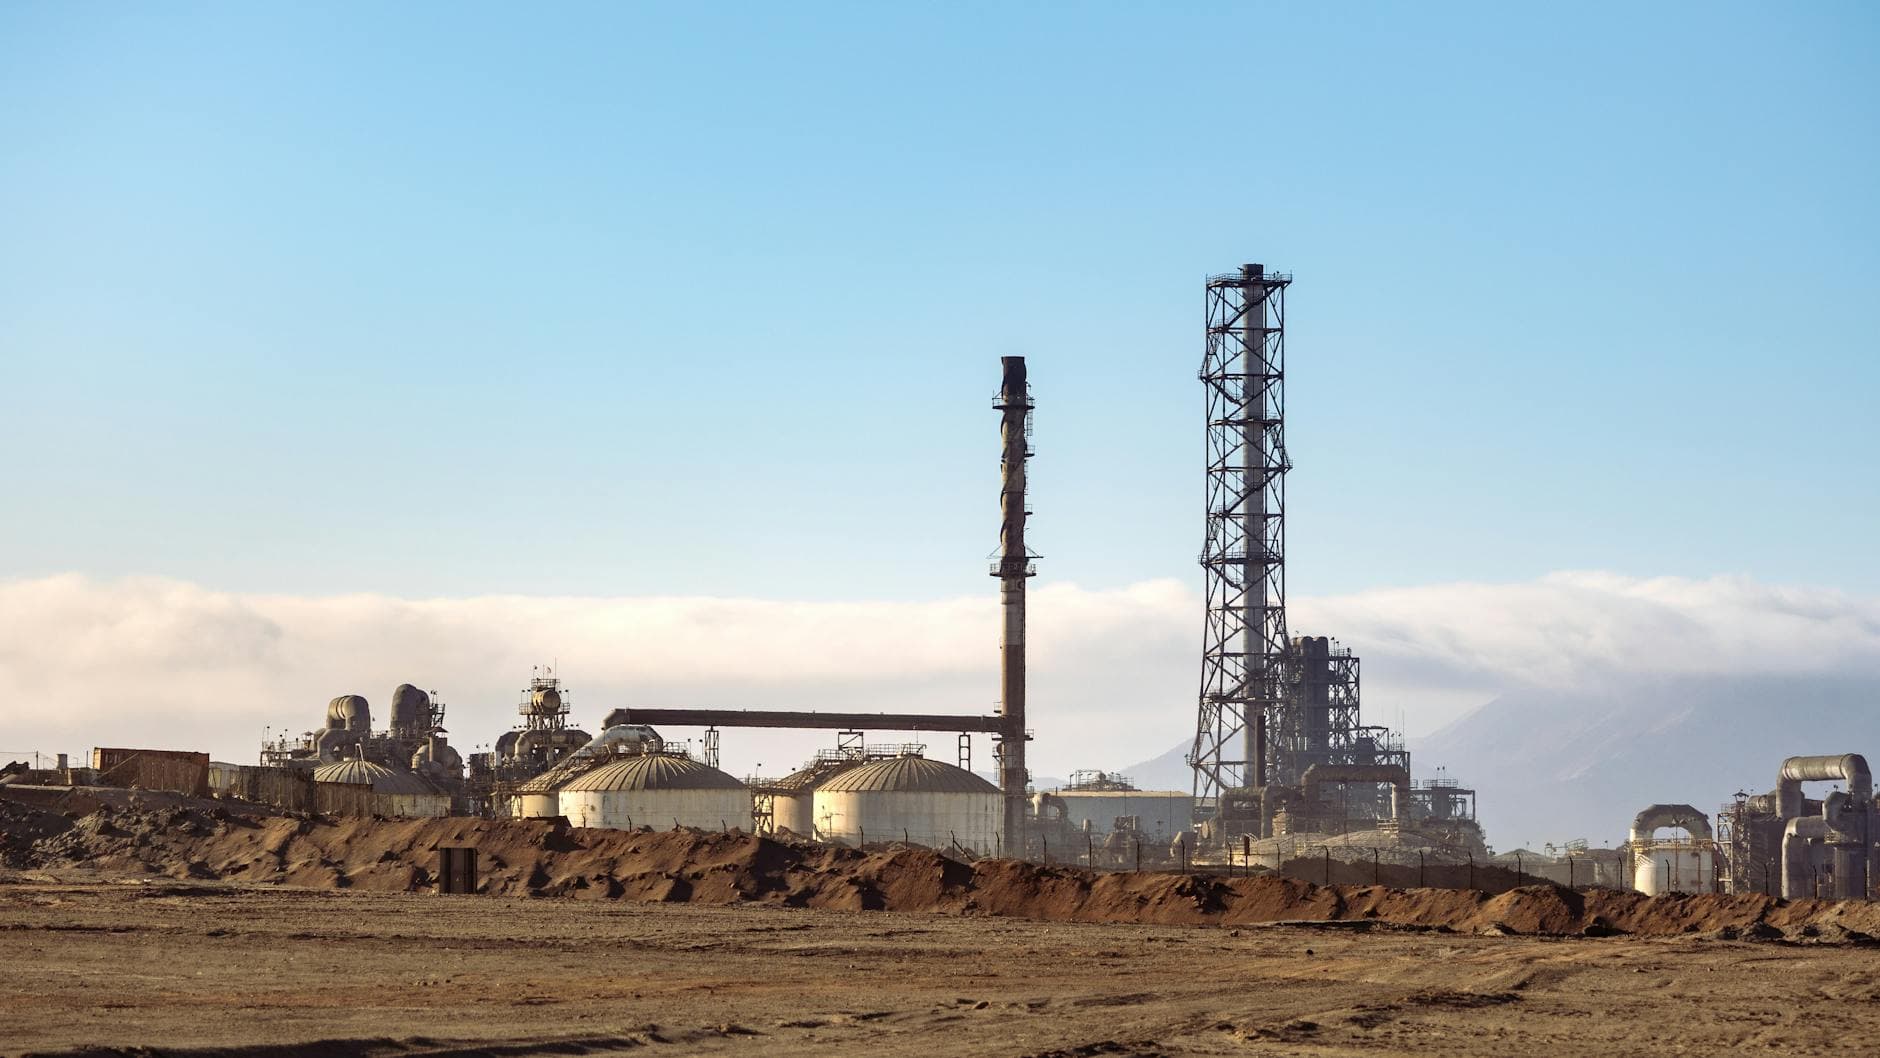
The contrast is stark. Saudi Arabia, sitting atop some of the world's largest gas reserves, is regressing toward oil-fired power. The kingdom's flagship Jafurah gas field began production late last year with a $100 billion price tag, described as the largest unconventional gas development outside the United States . But that production ramp takes time, and summer doesn't wait.

How Long Can Emergency Reserves Last?

U.S. Strategic Petroleum Reserve inventories fell by 9.9 million barrels in the week ended May 15, following a decline of 8.6 million barrels the previous week, taking total SPR volumes down to 374 million barrels , Standard Chartered reported. These are the largest consecutive weekly declines on record.

Context matters. The IEA's 32 member countries pledged a record 400 million barrels from strategic reserves after Iran's Hormuz blockade—more than double the 182.7 million barrels released during the 2022 Ukraine war response . The United States committed 172 million barrels, shouldering the lion's share . At current drawdown rates, the strategic reserve could drop to its lowest levels since the 1980s if withdrawals continue at this pace , according to analysis cited by Standard Chartered.

The physical infrastructure imposes hard limits. The SPR's maximum withdrawal capacity is 4.4 million barrels per day, while the operational minimum is a statutory limit of 150 million barrels . Do the math: the U.S. is roughly 224 million barrels above the floor. At 9 million barrels per week, that's about 25 weeks of runway—if nothing changes.

More than ten weeks after the war began, mounting supply losses from the Strait of Hormuz are depleting global inventories at a record pace, with benchmark oil prices posting wild swings in response to conflicting signals on whether the U.S. and Iran will reach a deal , the IEA noted in its May Oil Market Report. North Sea Dated traded in an unprecedented wide range of almost $50 per barrel in April, surging to an average of $120.36 per barrel .

What's Happening to Natural Gas Markets?

The Hormuz crisis isn't just an oil story. Over 110 billion cubic meters of LNG passed through the Strait in 2025, with about 93% of Qatar's and 96% of the UAE's LNG exports transiting through—representing almost one-fifth of global LNG trade , the IEA reported. There are no alternative routes for these volumes.

Regional gas production is also affected by shut-in oil fields, which has cut output of gas associated with oil production, and natural gas prices in Asian markets have risen sharply to attract more LNG cargoes , according to the IEA. This explains Saudi Arabia's predicament. The kingdom built its power sector around domestic gas. When that gas disappears as a byproduct of curtailed oil production, the only short-term substitute is burning crude or importing fuel oil.

According to market data, Henry Hub natural gas traded at $3.25 per MMBtu on Wednesday, down 2.4%. But that's a U.S. benchmark. Asian spot LNG prices have spiked far higher, reflecting the region's exposure to Middle Eastern supply disruptions.

What Changed This Week

Goldman Sachs reported that visible global oil inventories are contracting at 8.7 million barrels daily in May—almost double the rate seen earlier in the crisis . The U.S. SPR posted back-to-back record weekly declines, dropping to 374 million barrels . Wind and solar surpassed gas in global electricity generation for the first time in April, a structural milestone years in the making . And Saudi Arabia's fuel oil imports hit 360,000 barrels per day in April, up 86% year-on-year , as the kingdom burns through oil it would rather export.

What to Watch

The IEA's next Oil Market Report is due June 13. The EIA assumes the Strait of Hormuz will remain effectively closed through late May, with flows slowly resuming in late May or early June, though it expects production and trade patterns won't return to pre-conflict levels until late 2026 or early 2027 . Watch for any signs that Hormuz shipping traffic is normalizing—or deteriorating further.

Standard Chartered warns that many mechanisms implemented to reduce the near-term supply imbalance are only temporarily viable, and physical oil prices are likely to rise again once purchases can no longer be deferred, refinery runs pick up, and strategic reserve releases are complete . The EIA's Weekly Petroleum Status Report, due May 28, will show whether U.S. inventory drawdowns are accelerating or stabilizing. And Saudi Arabia's monthly power generation data, typically released with a six-week lag, will reveal whether summer oil burn is tracking toward that 1 million barrel-per-day threshold Rystad Energy projected.

The reserves that took decades to build are draining in weeks. The renewable capacity that took years to install is finally showing up in monthly generation data. The question is which trend line matters more—and how much time is left before one or the other runs out.

Coverage aggregated and synthesized from leading energy-sector publications. See linked sources within the article.

Share this story

More from Stake & Paper

Was this article helpful?

ClaimWatch

Mining claims intelligence — from query to report, in minutes.

Every unpatented mining claim across all twelve BLM states. Leadfile audits, due diligence, site selection, regional prospecting, entity investigations, and AOI monitoring — delivered as complete report packages.

4.4M+
Claims Tracked
12
BLM States
7
Report Types
Request a Sample Report
Stake & Paper AM

One morning brief. The whole energy sector.

Original analysis, the day's most important wire stories, and market data — delivered before your first cup of coffee. Free.