Renewables · Analysis
Wind and Solar Just Beat Gas Globally
For the first time ever, wind and solar generated more electricity than gas worldwide in April. Meanwhile, battery costs plunged 27% and U.S. storage hit a quarterly record—even as policy headwinds mount.
Stake & Paper Editorial TeamMay 24, 2026
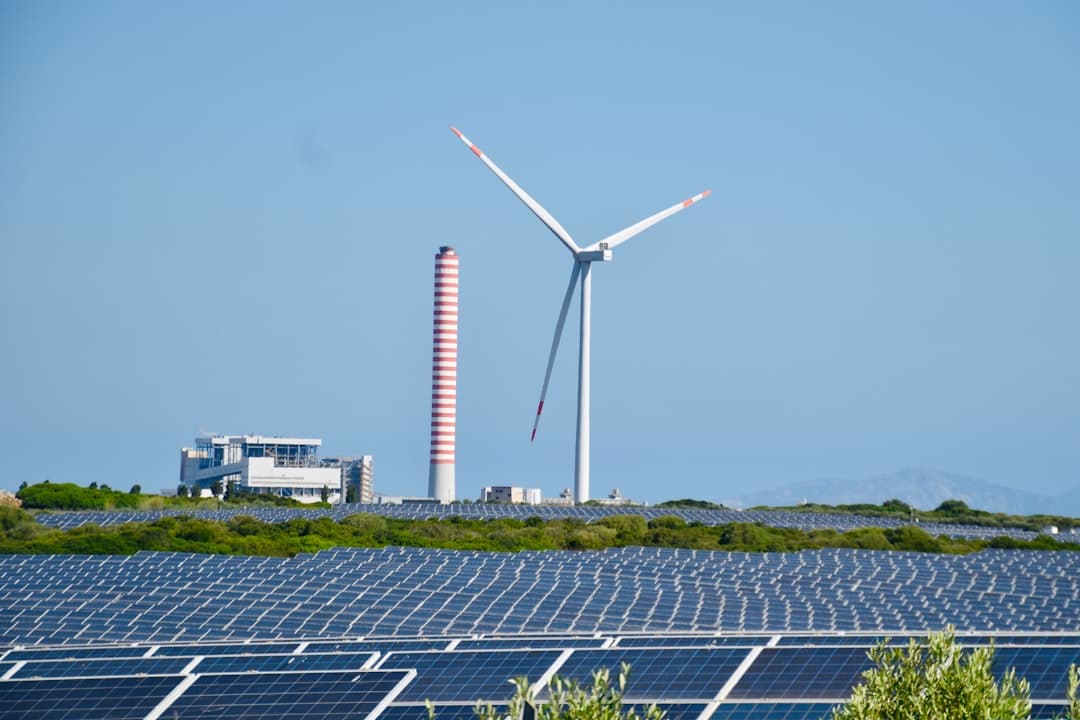
Wind and solar generated 531 terawatt-hours of electricity globally in April. Gas plants? Just 477 TWh.
For the first time in history, the two renewable sources produced more power than gas for a full month, according to energy think tank Ember—wind and solar accounted for 22% of global electricity generation compared to 20% from gas
. Five years ago, gas generation stood at nearly the same level.
But wind and solar combined generated just 245 TWh in April 2021—less than half of what they produced this April
.
The timing matters.
April marked the first full month of the latest global energy crisis tied to the conflict in the Middle East, and the data shows how quickly renewables are changing the power mix even as fossil fuel markets remain volatile
.
Ember says the latest numbers weren't driven by the current crisis itself but by years of rapid renewable energy growth—wind and solar grew fast enough in April to meet most of the increase in global electricity demand, which helped limit growth in gas generation
.
Can Renewables Hold This Lead?
Not yet on an annual basis.
Wind and solar have so far surpassed gas in only a single month and not on an annual basis, according to Ember data
.
April was the most likely month for this milestone, as spring conditions in the Northern Hemisphere typically combine strong wind generation with rising solar output, while electricity demand is relatively low between heating and cooling seasons
.
But the broader trend is unmistakable.
Solar power increased by a record 636 TWh to reach 2,778 TWh in 2025, a 30% increase from 2024—this new solar generation would be sufficient to displace gas-fired electricity equivalent to all LNG exports through the Strait of Hormuz last year, estimated at 550 TWh
.
In another global milestone, renewables overtook coal power in 2025—solar, wind, hydropower and other renewable sources together contributed more than a third of global electricity generation for the first time in the modern power system, while the share of coal power fell below a third for the first time in history
.
Growth accelerated across major economies.
China recorded 14% year-on-year growth in wind and solar generation, while the European Union achieved 13% growth, the United Kingdom posted a 35% increase, and the United States saw 8% growth—other notable increases included Australia at 17%, Chile at 24% and Brazil at 4%
.
What's Driving the Storage Boom?
While wind and solar grabbed headlines, battery storage quietly rewrote the economics of clean energy.
The global benchmark cost for a four-hour battery project fell 27% year-on-year to $78 per megawatt-hour in 2025—a record low since BloombergNEF began tracking costs in 2009, with lower pack prices, increasing competition among manufacturers and improved system designs all contributing to the rapid decline
.
That cost collapse is reshaping project economics.
Battery costs fell sharply for the second consecutive year—in 2024, battery costs dropped 20%, and in 2025, they fell a further 45%, while deployment grew 46% to an estimated 250 GWh
.
IRENA's analysis shows firm solar-plus-storage costs dropped from above $100/MWh in 2020 to $54/MWh to $82/MWh by 2025 at high-quality resource sites, with the agency projecting further reductions of roughly 30% by 2030 and around 40% by 2035
.
The United States led the charge.
U.S. energy storage installations climbed 31% compared to the same period last year, reaching 9.7 gigawatt-hours in the first three months of 2026, according to a report by the Solar Energy Industries Association and Benchmark Mineral Intelligence—this represented the best first-quarter performance ever recorded
.
Texas, Arizona and California led utility-scale installations in the quarter, with over 70% of utility-scale storage capacity installed in the period in states won by U.S. President Donald Trump
.
The SEIA said the demand is being driven by data centers, volatile electricity prices and disruptions to global gas and gas turbine supplies—major technology companies, including Google and Meta, have announced deals this year to procure tens of thousands of megawatt-hours of storage to power data centers needed to run AI technologies
.
When Too Much Sun Becomes a Problem
France discovered what happens when solar capacity grows faster than grid flexibility.
According to the Storio Energy Price Observatory, 90% of days in April recorded zero or negative prices on the day-ahead market, with prices falling as low as -€479 per megawatt-hour at 2:00 pm on April 26
.
Photovoltaic generation has surged, supported by approximately 6 GW of new capacity connected in 2025, with a significant share of this capacity, operating under feed-in tariff schemes, continuing to inject electricity into the grid even during periods of negative prices—meanwhile, the flexibility of nuclear generation has been more limited than a year earlier, with available capacity at around 28 GW in 2026 compared with approximately 24 GW in 2025
.
French solar power surged on Thursday as a stretch of sunny weather boosted generation allowing the country to export huge volumes of electricity to neighboring markets—solar generation climbed above 20 gigawatts at 12:15 pm Paris time, according to RTE data, and the surge in solar combined with almost 40 gigawatts of output from France's large fleet of nuclear power plants means the grid is running a large power surplus, with exports to neighbors including Germany, Italy and the UK reaching over 15 gigawatts
, Bloomberg reported.
The solution? More storage.
Five months after France moved to a 15-minute spot market interval in October 2025, battery energy storage system arbitrage revenues have risen by an average of 20%-plus compared with the previous hourly market—finer granularity increases opportunities to capture price spreads, strengthening the short-term storage business model
.
Are Homeowners Finally Going Solar?
Rising energy prices are doing what subsidies couldn't.
The national average residential electricity rate hit 18.05 cents per kilowatt-hour in early 2026, which is a 5.4% jump from 2025—according to the U.S. Energy Information Administration, retail electricity prices have been outpacing inflation since 2022 and are projected to keep rising
.
Home solar installations are responding. The RSS feed noted that soaring energy prices are driving a home solar boom, with households attracted to solar installations as oil and gas prices surge due to geopolitical challenges.
It costs about $28,000 to install solar panels—that's a big number, but it can come down significantly with generous incentives from the federal government, as well as from many states
.
But the incentive picture has shifted.
For 2026 installs, the Residential Clean Energy Credit (25D) is generally not available for expenditures made after December 31, 2025, so many 2026 projects may not qualify
.
At the federal level, only the Section 48E "Clean Electricity Investment Credit" remains available for residential solar in 2026—this credit can only be claimed by businesses, not individual taxpayers, but homeowners can benefit from this credit through third-party owned solar arrangements, such as leases, PPAs, and prepaid products
.
The economics still work.
On average, homeowners with a solar panel system save $41,000 to $62,000 on total avoided energy costs over 25 years—solar savings go the furthest in places with high electricity rates, like Connecticut, California and Hawaii
.
What Changed This Week
The April milestone confirmed what industry analysts have been tracking for years: renewables are no longer the future—they're the present. Wind and solar didn't just edge past gas; they beat it by 54 TWh while meeting most new electricity demand growth. Battery costs continued their relentless decline, falling to record lows that make 24/7 renewable power economically viable in high-quality resource regions. And the U.S. storage market posted its strongest first quarter ever, driven not by subsidies but by data center demand and volatile grid prices.
What to Watch
American developers are on track to bring more than 610 GWh of energy storage online by 2030
, but
SEIA cautioned that federal permitting delays could hinder the industry, with the organization's analysis identifying 467 solar and storage projects with pending permits that are susceptible to politically motivated holdups or cancellations
. Watch whether May and June electricity generation data shows wind and solar maintaining their lead over gas, or whether April's spring conditions prove unrepeatable. France's negative pricing crisis will test whether European grids can integrate solar faster than they can build storage. And in the U.S., the expiration of the residential solar tax credit will reveal whether rising electricity costs alone can sustain home solar demand—or whether the market shifts entirely to third-party ownership models that can still access federal credits.